
SL Paper 1
A student obtained the following data to calculate , using .
What is the percentage uncertainty in the calculated value of ?
A.
B.
C.
D.
A student measured the change in mass on heating a sample of calcium carbonate, CaCO3(s). What is the mass loss?
Mass before heating: 2.347 g ± 0.001
Mass after heating: 2.001 g ± 0.001
A. 0.346g ± 0.001
B. 0.346g ± 0.002
C. 0.35g ± 0.002
D. 0.35g ± 0.001
What is the Index of Hydrogen Deficiency (IHD) for 1,3,5-hexatriene (C6H8)?
A. 1
B. 3
C. 5
D. 6
What is the density, in gcm−3, of a 34.79 g sample with a volume of 12.5 cm3?
A. 0.359
B. 0.36
C. 2.783
D. 2.78
How should the difference between 27.0 ± 0.3 and 9.0 ± 0.2 be shown?
A. 18.0 ± 0.1
B. 18.0 ± 0.3
C. 18.0 ± 0.5
D. 18.0 ± 0.6
What is the graphical relationship between n and T in the ideal gas equation, pV = nRT, all other variables remaining constant?

Which region of the electromagnetic spectrum is used to identify hydrogen environments in a molecule?

A. X-ray
B. UV
C. IR
D. radio waves
Determine the index of hydrogen deficiency (IHD) of paracetamol.

A. 3
B. 4
C. 5
D. 6
What is the ratio of the areas of the signals in the 1H NMR spectrum of pentan-3-ol?
A. 6:4:1:1
B. 6:2:2:2
C. 5:5:1:1
D. 3:3:2:2:1:1
Which feature of a molecule does infrared spectrometry detect?
A. molecular mass
B. bonds present
C. total number of protons
D. total number of proton environments
What is the index of hydrogen deficiency, IHD, of 3-methylcyclohexene?
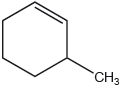
A. 0
B. 1
C. 2
D. 3
What is the uncertainty, in cm3, of this measurement?
A. ±0.01
B. ±0.1
C. ±0.15
D. ±1
Which graph shows the relationship between the pressure and volume of a sample of gas at constant temperature?

What can be deduced from the mass spectrum of CH3COCH2CH2CH3?

NIST Mass Spectrometry Data Center Collection (C) 2021 copyright by the U.S. Secretary of Commerce on behalf of the United States of America. All rights reserved. 2-Pentanone Mass Spectrum, MS Number 291264. [graph] Available at: https://webbook.nist.gov/cgi/cbook.cgi?ID=C107879&Units=SI&Mask=200#Mass-Spec2-pentanone [Accessed 4 May 2020]. source adapted.
A. The molar mass is 43 g mol−1.
B. The atoms have many isotopes.
C. The most likely bond to break is C–C between carbons 2 and 3.
D. The signal with the largest mass is due to the oxidation of the ketone in the spectrometer.
A student performed an experiment to find the melting point of sulfur, obtaining 118.0 °C. The literature value is 115.2 °C. What was the percentage error?
A.
B.
C.
D.
What is the index of hydrogen deficiency (IHD) in cyclohexanol?

A.
B.
C.
D.
A student performs an acid-base titration using a pH meter, but forgets to calibrate it. Which type of error will occur and how will it affect the quality of the measurements?
A. Random error and lower precision
B. Systematic error and lower accuracy
C. Systematic error and lower precision
D. Random error and lower accuracy
What is always correct about the molecular ion, M+, in a mass spectrum of a compound?
A. The M+ ion peak has the smallest m/z ratio in the mass spectrum.
B. The m/z ratio of the M+ ion peak gives the relative molecular mass of the molecule.
C. The M+ ion is the most stable fragment formed during electron bombardment.
D. The M+ ion peak has the greatest intensity in the mass spectrum.
What can be determined about a molecule from the number of signals in its 1HNMR spectrum?
A. Bonds present
B. Molecular formula
C. Molecular mass
D. Number of hydrogen environments
Which graph represents the relationship between the amount of gas, n, and the absolute temperature, T, with all other variables in the ideal gas equation, PV = nRT, held constant?

The enthalpy of combustion of a fuel was determined using the calorimeter shown. The final result was lower than the literature value.

Which factors could have contributed to this error?
I. Not all heat from the combustion was transferred to the calorimeter.
II. Incomplete combustion occurred.
III. The temperature probe touched the bottom of the calorimeter.
A. I and II only
B. I and III only
C. II and III only
D. I, II and III
How many signals are observed in the 1H NMR spectrum of this compound?
A. 1
B. 2
C. 3
D. 4
A reaction has an activation energy of 40 kJ mol−1 and an enthalpy change of −60 kJ mol−1.
Which potential energy diagram illustrates this reaction?

How are the uncertainties of two quantities combined when the quantities are multiplied together?
A. Uncertainties are added.
B. % uncertainties are multiplied.
C. Uncertainties are multiplied.
D. % uncertainties are added.
What is the degree of unsaturation (index of hydrogen deficiency) for the molecule?

A. 1
B. 2
C. 4
D. 5
What information is provided by 1H NMR, MS and IR for an organic compound?
I. 1H NMR: chemical environment(s) of protons
II. MS: fragmentation pattern
III. IR: types of functional group
A. I and II only
B. I and III only
C. II and III only
D. I, II and III
A liquid was added to a graduated cylinder. What can be deduced from the graph?


The enthalpy of combustion of ethanol is determined by heating a known mass of tap water in a glass beaker with a flame of burning ethanol.
Which will lead to the greatest error in the final result?
A. Assuming the density of tap water is 1.0 g cm−3
B. Assuming all the energy from the combustion will heat the water
C. Assuming the specific heat capacity of the tap water is 4.18 J g−1 K−1
D. Assuming the specific heat capacity of the beaker is negligible
Which value of q, in J, has the correct number of significant figures?
q = mcΔT
where m = 2.500 g, c = 4.18 J g−1 K−1 and ΔT = 0.60 K.
A. 6
B. 6.3
C. 6.27
D. 6.270
What is the name of this compound using IUPAC rules?

A. 2,3-diethylbutane
B. 2-ethyl-3-methylpentane
C. 3-methyl-4-ethylpentane
D. 3,4-dimethylhexane
Data collected from a larger number of silicon samples could also be plotted to determine the density using the following axes.

Which statements are correct?
I. The density is the slope of the graph.
II. The data will show that mass is proportional to volume.
III. The best-fit line should pass through the origin.
A. I and II only
B. I and III only
C. II and III only
D. I, II and III
The dotted line represents the formation of oxygen, O2(g), from the uncatalysed complete decomposition of hydrogen peroxide, H2O2 (aq).

Which curve represents a catalysed reaction under the same conditions?
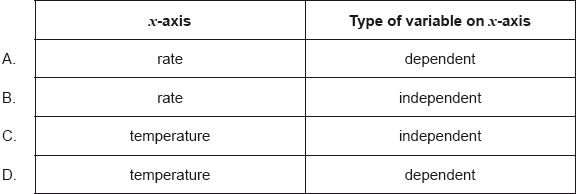
The rate of a reaction is studied at different temperatures.
Which is the best way to plot the data?
What is the slope of the graph?

A. −0.0025 mol dm−3 s−1
B. −0.0025 mol dm−3 s
C. −0.0033 mol dm−3 s−1
D. −0.0033 mol dm−3 s
What are the absolute and percentage uncertainties for the change in mass?
Initial mass: 22.35 ±0.05 g
Final mass: 42.35 ±0.05 g

Consider the mass spectrum of an element:

What is the relative atomic mass of this element?
A. 10.2
B. 10.5
C. 10.8
D. 10.9
Burette readings for a titration are shown.

What is the mean titre?
A. 11.1 cm3 ± 0.1 cm3
B. 11.15 cm3 ± 0.05 cm3
C. 11.2 cm3 ± 0.05 cm3
D. 11.2 cm3 ± 0.1 cm3
What is the index of hydrogen deficiency (IHD) of this molecule?
Paracetamol (acetaminophen)

A. 3
B. 4
C. 5
D. 6
What is the value of the temperature change?
Initial temperature: 2.0 ± 0.1 °C
Final temperature: 15.0 ± 1.0 °C
A. 13.0 ± 0.1 °C
B. 13.0 ± 0.9 °C
C. 13.0 ± 1.0 °C
D. 13.0 ± 1.1 °C
Questions 13 and 14 are about an experiment to measure the enthalpy of combustion, ΔHc, of ethanol, using the apparatus and setup shown.

Which quantity is likely to be the most inaccurate due to the sources of error in this experiment?
A. Mass of ethanol burnt
B. Molecular mass of ethanol
C. Mass of water
D. Temperature change
What can be deduced from the infrared (IR) spectrum of a compound?
A. Number of hydrogens
B. Number of hydrogen environments
C. Bonds present
D. Molar mass
What is the ratio of areas under each signal in the 1H NMR spectrum of 2-methylbutane?
A. 6 : 1 : 2 : 3
B. 3 : 3 : 1 : 5
C. 6 : 1 : 5
D. 3 : 3 : 1 : 2 : 3
20 cm3 of 1 mol dm−3 sulfuric acid was added dropwise to 20 cm3 of 1 mol dm−3 barium hydroxide producing a precipitate of barium sulfate.
H2SO4 (aq) + Ba(OH)2 (aq) → 2H2O (l) + BaSO4 (s)
Which graph represents a plot of conductivity against volume of acid added?

Which compound produces this mass spectrum?

[Spectral Database for Organic Compounds, SDBS. SDBS Compounds and Spectral Search. [graph] Available at:
https://sdbs.db.aist.go.jp [Accessed 3 January 2019].]

Which spectra would show the difference between propan-2-ol, CH3CH(OH)CH3, and propanal, CH3CH2CHO?
I. mass
II. infrared
III. 1H NMR
A. I and II only
B. I and III only
C. II and III only
D. I, II and III
Which information can be gained from an infrared (IR) spectrum?
A. Ionization energy of the most abundant element
B. Number of different elements in the compound
C. Bonds present in a molecule
D. Molecular formula of the compound
How should a measurement of 5.00 g from a balance be recorded?
A. 5.00 ± 0.1 g
B. 5.00 ± 0.01 g
C. 5.00 ± 1 g
D. 5.00 ± 0.001 g
What can be deduced from the following 1HNMR spectrum?

A. There is only one hydrogen atom in the molecule.
B. There is only one hydrogen environment in the molecule.
C. The molecule is a hydrocarbon.
D. There is only one isotope in the element.
The following data were recorded for determining the density of three samples of silicon, Si.

Which average density value, in g cm−3, has been calculated to the correct number of significant figures?
A. 2
B. 2.3
C. 2.27
D. 2.273
Which is correct for the spectra of organic compounds?
A. Mass spectroscopy provides information about bond vibrations.
B. 1H NMR spectroscopy provides the values of carbon–hydrogen bond lengths.
C. Infrared spectroscopy provides the number of hydrogen atoms.
D. Mass spectroscopy provides information about the structure.
What is the index of hydrogen deficiency (IHD) for this molecule?

A. 3
B. 4
C. 5
D. 6